The recent July 2022 evaluation by CONCAWE compared the performance of various field based analysis methods for petroleum hydrocarbons compared to an accredited laboratory GC-MS method. This paper expands on the conclusions made by this report.
Of the seven field based methods evaluated, only 3 gave results that were within the MCERTS guidance range compared to the reference GC-MS method across the entire 10 mg/kg to 10,000 mg/kg range, the range typically needed for environmental professionals. These were a portable GC-MS the Griffin G510, the infra red based Infracal 2 and the fluorescence based QED HC-1. The other methods were shown to have limitations when the hydrocarbon concentration was below 500 mg/kg.
The report also identified other limitations of the technologies evaluated but has not given any indication of the cost/benefits of each technology when considering these issues.
Hydrocarbon Identification
For a site investigation or for waste classification it is essential to be able to identify the hydrocarbon type. A better risk assessment can be made if the hydrocarbon type can be identified as for example, a diesel, gasoline, lubricating oil, kerosene or bitumen. For waste classification, knowing the soil contains diesel means the allowed non hazardous limit is 10,000 mg/kg compared to 1,000 mg/kg for an unknown hydrocarbon. The report does identify in Table 1 (below) that only the portable GC-MS and the QED are capable of identifying the hydrocarbon type.
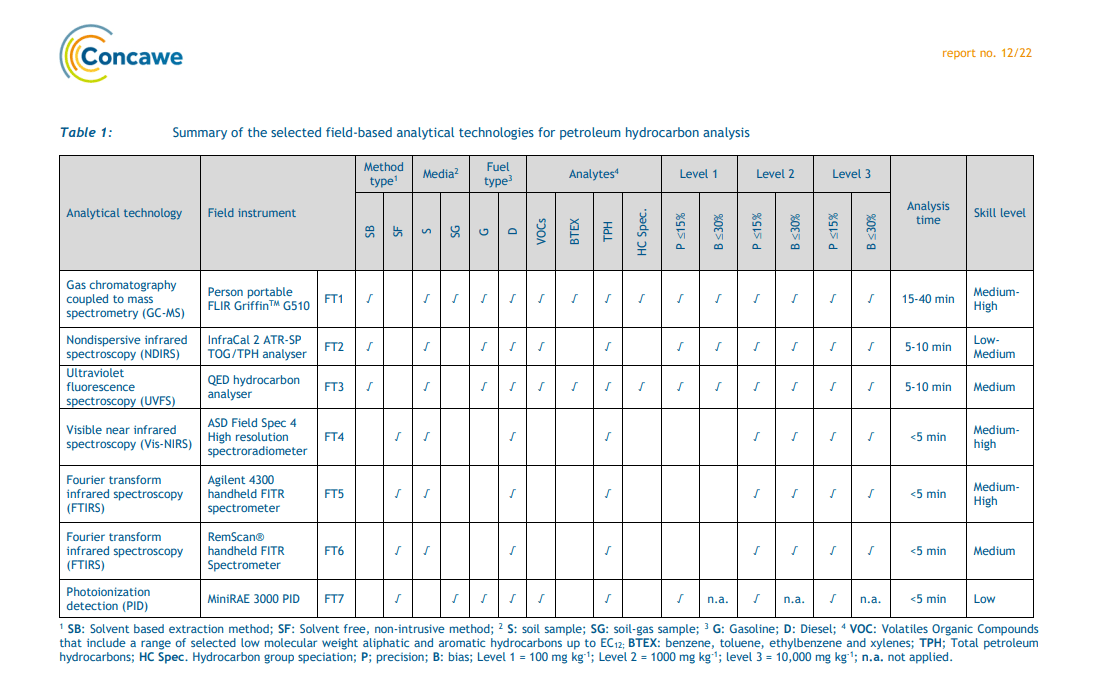
The other significant source of hydrocarbon of environmental relevance is from coal tar. The hydrocarbon from this material is frequently included in the “TPH” analysis, but is not petroleum derived. The hazard in coal tar comes from the PAHs, phenolics and azaarenes. If coal tar is present, but the analyser is calibrated with a typical petroleum hydrocarbon calibration solution, an incorrect and typically much lower result will be generated. Petroleum contamination and coal tar contamination is frequently found on the same site. The standard TPH laboratory methods are unlikely to identify if coal tar is in the sample and this can have serious consequences for users of the analysis data. The QED can readily and automatically differentiate between coal tar hydrocarbons and petroleum based hydrocarbons.
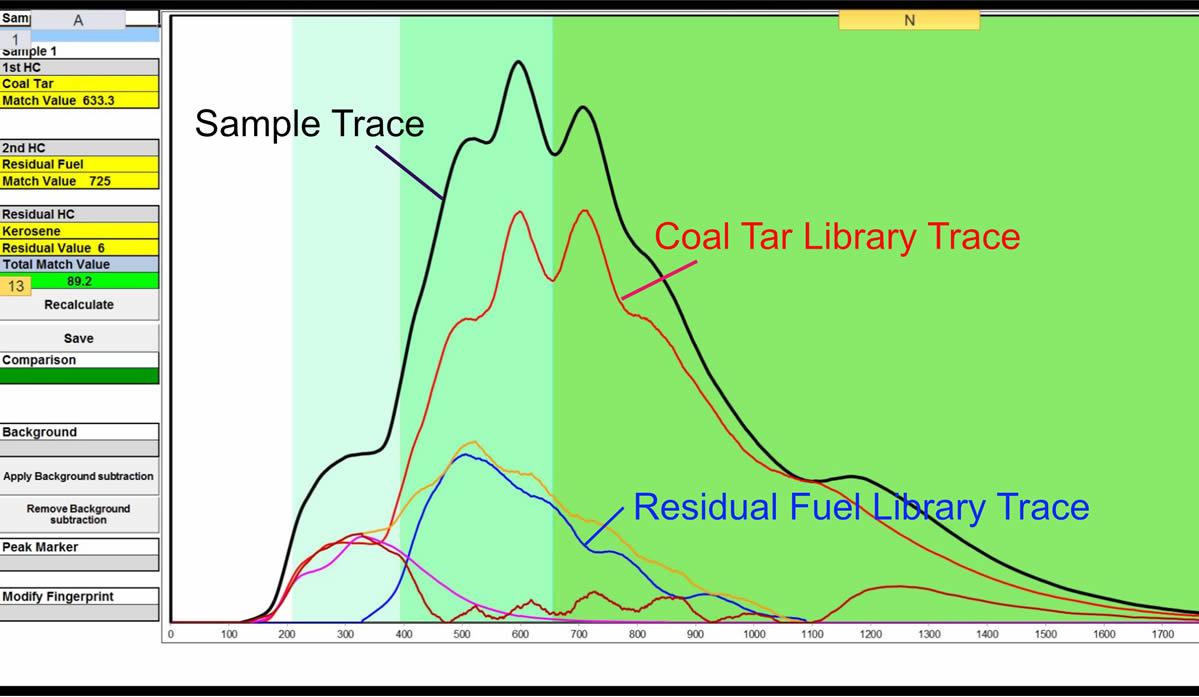
The different hydrocarbon types used to calibrate the QED have distinctive fingerprints that allows a reliable and accurate hydrocarbon identification to be made. All identifications are given a % confidence in the match giving operators and users of the data confidence in the results generated. The ability of the QED to accurately identify the hydrocarbon type is actually better than the GC-MS systems, but this feature was not evaluated in this study.
The QED can identify up to 4 hydrocarbon types within the raw sample data and assigns the proportions of each of the identified hydrocarbons to the appropriate calibration curve. This allows accurate analysis for mixtures of hydrocarbons such as diesel and gasoline and also factors in the degradation of the hydrocarbon. Most contaminated sites contain a mixture of hydrocarbons all with varying levels of degradation. The QED automatically takes this into account and is therefore less likely to generate false results in the real world. The other analysers rely on the user knowing or making a guess as to the type of hydrocarbon that will be found on site.
By identifying the hydrocarbon type, the QED is prevented from analysing a sample using an incorrect calibration set up. As this occurs automatically, the user does not need to set any particular calibration type, unlike the Infracal. This makes in field use simpler and more reliable.
Calibration
All of the tested analysers, including the reference GC-MS method require calibration. The variability of the chemistry within each hydrocarbon type means that for accurate results, an appropriate and representative calibration compound must be used. The InfraCal system was calibrated using a diesel calibrator when analysing samples known to contain diesel and gasoline for samples known to contain gasoline.
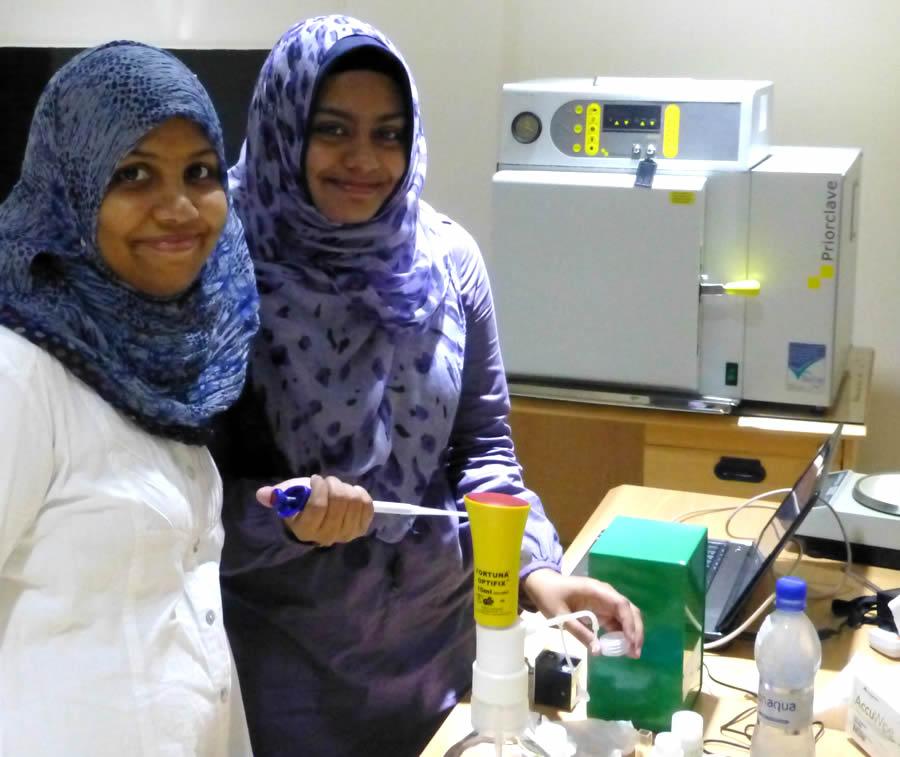
The portable GC-MS used a mixture of generic aromatic and aliphatic compound calibrator solutions selected to cover the expected C5 – C35 hydrocarbon range. A calibration run must be carried out daily and takes at least an hour, typically 2 hours and calibration checks every 20 samples. By contrast, the QED uses a single solution field calibration called Scan Set that is independent of the hydrocarbon type expected and is performed in under 30 seconds. The calibration is checked automatically after every 10 samples or after 2 hours has elapsed since the last calibration check or if a significant temperature or baseline change is detected. The Scan Set solution is used to carry out these checks and the variance which is reported on the results output is typically less than 5%.
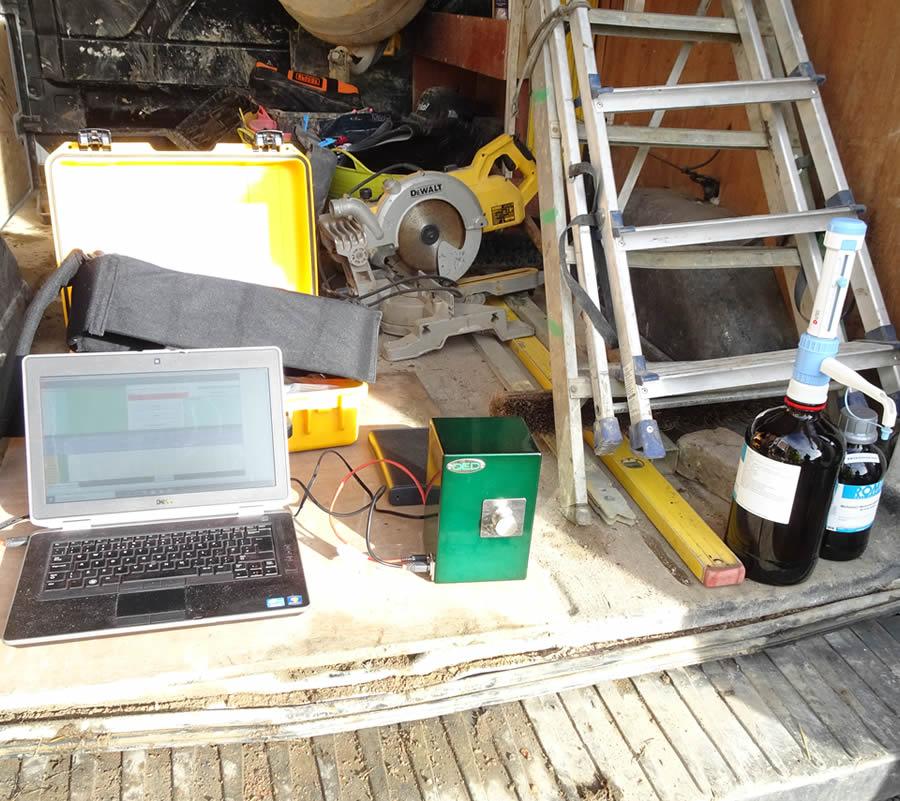
The QED is pre-calibrated during manufacture (or on the annual service) with degraded and undegraded gasoline, degraded and undegraded diesel, kerosene, 3 types of jet fuel (JP5,JP8, Jet A1), heavy fuel oil, bitumen, mineral based lube oil (used motor oil and undegraded oil), hydraulic oil and transformer oil, 2 types of bitumen based road binder and 2 types of coal tar. Calibration curves for poly aromatic hydrocarbons (PAHs), BTEX and phenol are also created. The field calibration using the Scan Set solution recreates the entire calibration set in under 30 seconds. This feature is a significant improvement on standard laboratory practise which simply uses typical standard fuel hydrocarbon calibrants (BTEX, DRO and a mineral oil).
To ensure the Scan Set is suitable for use, the QED can identify if it is contaminated, degraded or an incorrect concentration and prevents analysis if the Scan Set is not within QC limits. This method ensures valid calibration curves are easily created.
Differentiating between volatile and extractable hydrocarbon groups and PAHs
“Among the FT evaluated in this study, the UFV field technology (FT3) can provide simultaneously determination for total BTEX, GRO C5-C9, DRO C10-C40, TPH C5- C40, and total aromatics C10-C35 within roughly 5 min (QROS, 2020). This offers advantageous time saving for individual soil sample analysis compared to GC-MS methods typically ranging between 20 and 25 min for headspace analysis (BTEX and GRO) and 36-40 min run for DRO and TPH C10-C35 analysis (Concawe 2021)” Concawe 2022 (FT3 = QED)
For risk assessment and for devising remediation strategies, knowing the proportions of the gasoline range, diesel range and poly aromatics content in the hydrocarbon is useful. This study shows that the QED analyser is the only other system apart from GC-MS that can identify and quantify the BTEX, GRO and DRO fractions. The report however does not make it clear that the portable GC-MS (as does the lab based GC-MS) requires two separate analysis runs to obtain these values, each taking about 20 minutes and requiring separate calibrations for each. The QED gives these results in the same analysis as all the other parameters. The QED analysis time is actually under 10 seconds. In the field, the time needed to set up the GC-MS for each run would be approximately 1 hour, meaning samples could only be run in batches. This gives a real world sample throughput outside the conventional laboratory of at least 80 samples per day with a QED and barely 15 per day with the portable GC-MS.
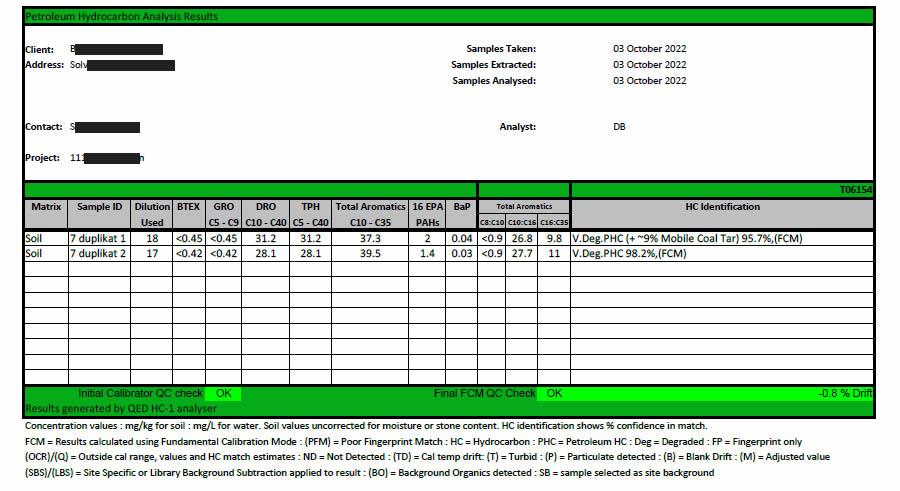
Results page generated by QED within 2 seconds of sample analysis, showing carbon banding as well as BTEX, GRO, DRO, TPH, Total Aromatics, the16 target PAHs and BaP.
The report also shows the reference laboratory GC-MS also generated results for total C5 – C35 aliphatics and total C5 – C35 aromatics. The QED also generated values for these bands and in most cases were equivalent to the reference laboratory GC-MS analysis. The largest discrepancies came from sub 10mg/kg concentrations where the QED was able to report lower values than the GC-MS method. (The reference GC-MS method has a limit of quantitation of 10 mg/kg. Anything below this is reported as <10. The QED limit of quantitation is 1 mg/kg. If the GC-MS shows <10 and the QED shows 5, the difference is shown is 50%. This is artefact, ie something observed in a scientific investigation or experiment that is not naturally present but occurs as a result of the preparative or investigative procedure. and not real.) What is not shown in the report is that the QED also generates a sum of the 16 PAHs concentration result, as well as the Benzo a Pyrene concentration. This data is also generated in the sub 10 second analysis that generates the BTEX, GRO, DRO and TPH values. The QED is the only analyser in this group that provides this data in the same single run analysis.
The Infracal system is unable to differentiate between PAHs and general TPH.
Sample Preparation
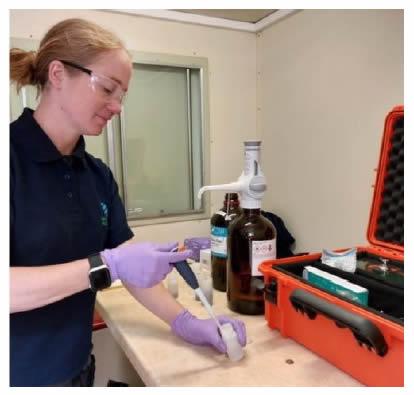
Sample preparation is an often overlooked but key item for any analysis system. Of the 3 systems identified as being suitable for the entire range, all use a solvent extraction procedure to extract the hydrocarbon and place it into the analyser. The portable GC-MS system used the same extract as prepared for the lab based GC-MS and involved 16 hours shaking in solvent followed by 30 minutes sonication. This makes it impractical as an on site analyser. Most samples analysed by the QED should be shaken for a few seconds, the maximum time is about a minute.
The GC-MS system requires dichloromethane, a hazardous material that is expensive to dispose of, whereas the QED uses methanol, an environmentally benign biodegradable solvent. The Infracal uses hexane and approximately 10g of sample is shaken with 10 ml of hexane for 2 minutes. Hexane is a hydrophobic solvent and moisture in the sample above 5% can significantly inhibit the extraction efficiency. In this evaluation, the spiked soils were air dried for 17 days before any hydrocarbon was added. The certified reference standard was also a dry material. This may not be representative of soils from a contaminated site in the winter months or shortly after a rain shower in the summer.
The QED uses methanol to extract the hydrocarbon. Methanol is miscible with water and even high moisture content (25%) does not affect the extraction efficiency for a typical fuel based hydrocarbon. Numerous studies carried out in the 1990s during the US EPA evaluation of the immunoassay kits for petroleum hydrocarbons showed methanol extraction was >80% efficient for all soil types, provided the moisture content was less than 25%. Methanol is also low cost and is the most environmentally acceptable solvent used in this evaluation.
All of the analysers evaluated have a calibration range where the calculation of the TPH concentration is the most accurate. In many cases the user is expected to have sufficient knowledge to check that the results generated are within the calibration range. On site however, the TPH concentration can vary very significantly from sample to sample and checking if the reported concentration is genuine or may be an artefact due to it being outside the calibration range can be missed. The QED is unique in being able to assess the concentration of hydrocarbon detected during the analysis and if it is outside of the calibration range, alert the user and suggest a suitable sample dilution that will put it into range.
Potential Interference and errors in the Analysis
The report mentions that background organics can affect the TPH value reported. It is well known that grass, peat and other plant derived materials can give elevated TPH values for several analysis methods, most notably GC-FID methods. GC-MS minimizes the problem by only measuring substances within a particular m/z range. The Infracal method uses infra red reflectance, a procedure where the volatile extraction solvent is allowed to evaporate from the sample extract leaving a film of the extracted compounds on the measurement surface. If the sample contains volatile compounds, such as those found in gasoline or undegraded diesel or kerosene, these will be lost from the analysis. This is why the Infracal must be told to expect gasoline and factor in these losses at the setup stage. The solvent used by the Infracal extraction method should help reduce the effects of humic acids (derived from degraded plant matter), but undegraded plant matter contains waxes and other hydrocarbons that will give a significant Infra Red signal and these readily dissolve in hexane. Biodiesel will also give a high TPH reading with infra red methods.
The QED can recognize the presence of humic acids, but has a very low sensitivity to them. This reduces the impact of these potentially interfering compounds. The background subtraction system built into the QED can be used to subtract out the effects of background organics when the TPH concentration is below 100 mg/kg. TPH concentrations above this are not affected because the sample is sufficiently diluted to remove the effects of these compounds. The QED can also detect the presence of chlorophyll. Chlorophyll is associated with relatively undegraded leaves, algae and some types of bark. If chlorophyll is present, plant waxes will also be present and these can give artificially elevated TPH values with other methods. The QED marks any samples analysed with a (BO) marker to highlight that background organics, either from humic acids or chlorophyll are present. These compounds are unlikely to change the QED results significantly, but if comparison is made with another analysis method, this marker can alert a user that the other method may give a higher TPH value than is actually present.